Introduction
In the world of managing databases, sometimes we face surprising problems with systems like Microsoft SQL Server. This can be tough for both developers and administrators. Recently, we’ve seen a good example of this with an issue related to spinlocks in SQL Server. It shows us just how complex and detailed these database systems can be.
There’s a strange problem affecting systems using 1C:Enterprise, and it’s all about how TRUNCATE operations work. Usually, TRUNCATE is quick and efficient for clearing big tables, but in some cases, it’s not working as expected and is causing issues.
To start understanding this problem, there’s a really interesting article on Habr that looks into it. It’s one of the first times this issue has been publicly explored: Странное поведение MS SQL Server 2019: длительные операции TRUNCATE(which means ‘Strange Behavior of MS SQL Server 2019: Long TRUNCATE Operations’). It’s written in Russian, but don’t worry, I’ll give a summary of the key points in English right here.
Problem Description
The core of the issue lies in the unexpected and prolonged duration of TRUNCATE commands in SQL Server 2019 and newer (admittedly, I have not verified whether this issue also exists in older versions). Typically, a TRUNCATE operation is near-instantaneous. However, in the cases observed, these commands were taking significantly longer – ranging from 5 to 20 seconds, and sometimes even more.
Observations and Experiments
In summarizing the insightful findings from an external article, we’ve highlighted several key observations:
- High CPU Consumption: A startling aspect of this issue was the substantial CPU resources consumed by the TRUNCATE operations.
- Specific to SQL Server 2019: This peculiar behavior seems to be exclusive to SQL Server 2019. Prior versions of SQL Server did not exhibit this anomaly, pointing to a version-specific characteristic or change in the newer release.
- Temporary Resolution: Temporarily, restarting the SQL Server seemed to mitigate the problem, but this was not a permanent fix. The issue reemerged within a few days.
- Processor Time Correlation: the duration of the TRUNCATE commands appeared to be directly correlated with processor time.
- Independence from Row Count: number of rows in the temporary table did not seem to influence the duration of the TRUNCATE command, suggesting that the issue was not related to the volume of data being processed.
- Reproduction Difficulties: The article also documented challenges in replicating the issue under test conditions, with variations in intensity and row counts in temporary tables failing to consistently recreate the problem, complicating the diagnosis.
Having outlined the significant points from the external article’s examination, we will now pivot to my investigation, where we’ll explore the root cause and present a SQL Server-side workaround that I’ve identified to effectively tackle this issue.
Troubleshooting
Confirm the existence of the problem.
When faced with an anomalous performance issue in SQL Server, especially one as elusive as the one in question, it’s crucial to adopt a systematic approach to troubleshooting. The first step in our troubleshooting process is to confirm the existence of the problem. To do this, we use SQL Server’s Extended Events, a highly configurable system that allows us to monitor and collect data about SQL Server’s operation.
Extended Event session code:
CREATE EVENT SESSION [truncate] ON SERVER
ADD EVENT sqlserver.sql_statement_completed(SET collect_statement=(1)
    ACTION(package0.callstack,sqlos.cpu_id,sqlos.scheduler_id,sqlos.task_time,sqlserver.session_id,sqlserver.username)
    WHERE ([sqlserver].[like_i_sql_unicode_string]([statement],N'TRUNCATE TABLE%') AND [cpu_time]>=(100000)))
ADD TARGET package0.event_file(SET filename=N'truncate.xel',max_rollover_files=(0))
WITH (MAX_MEMORY=4096 KB,EVENT_RETENTION_MODE=ALLOW_SINGLE_EVENT_LOSS,MAX_DISPATCH_LATENCY=30 SECONDS,MAX_EVENT_SIZE=0 KB,MEMORY_PARTITION_MODE=NONE,TRACK_CAUSALITY=OFF,STARTUP_STATE=OFF)
GO
We have the flexibility to run this session for a few minutes or even a few hours. However, it’s important to note that collecting data on ‘sql_statement_completed’ events might impact performance, particularly when the collection extends over a long period and on systems with high activity.
Results below:
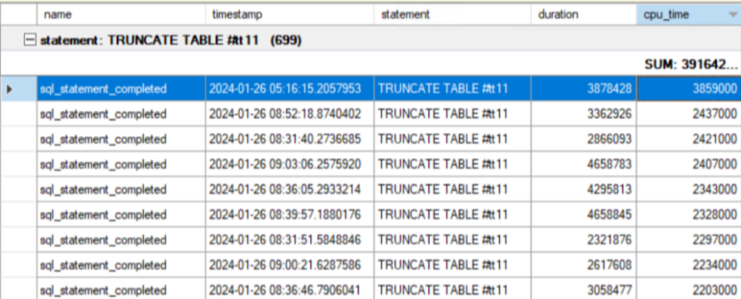
From the collected data, we observed multiple occurrences of the TRUNCATE TABLE statement being executed against a temporary table.
High CPU Time: The cpu_time column, representing the amount of CPU time used by the process, shows exceedingly high values. In some instances, the CPU time reaches nearly 4 seconds (e.g., 3859000 microseconds), which is an order of magnitude higher than what one would expect from a TRUNCATE operation, typically a metadata-only operation that does not physically process each row.
Spinlock or Investigate high CPU usage.
The next step in troubleshooting the TRUNCATE TABLE performance issue is to investigate whether spinlocks might be contributing to the high CPU usage observed. Spinlocks are low-level synchronization primitives used by SQL Server to manage access to its internal structures, and contention on these spinlocks can lead to increased CPU utilization.
Below is an Extended Event session to capture spinlock_backoff events, which occur when a thread decides to back off after failing to acquire a spinlock. By collecting this data, we can determine if spinlock contention is occurring during the execution of TRUNCATE TABLE statements and if it’s a factor in the high CPU usage.
CREATE EVENT SESSION [spin_lock_backoff] ON SERVER
ADD EVENT sqlos.spinlock_backoff(
    ACTION(package0.callstack,sqlserver.sql_text)
    WHERE ([sqlserver].[like_i_sql_unicode_string]([sqlserver].[sql_text],N'truncate table%')))
ADD TARGET package0.event_file(SET filename=N'spin_lock_backoff.xel',max_rollover_files=(0)),
ADD TARGET package0.histogram(SET filtering_event_name=N'sqlos.spinlock_backoff',source=N'package0.callstack',source_type=(1))
WITH (MAX_MEMORY=51200 KB,EVENT_RETENTION_MODE=ALLOW_SINGLE_EVENT_LOSS,MAX_DISPATCH_LATENCY=30 SECONDS,MAX_EVENT_SIZE=0 KB,MEMORY_PARTITION_MODE=PER_NODE,TRACK_CAUSALITY=OFF,STARTUP_STATE=OFF)
GO
Results below:
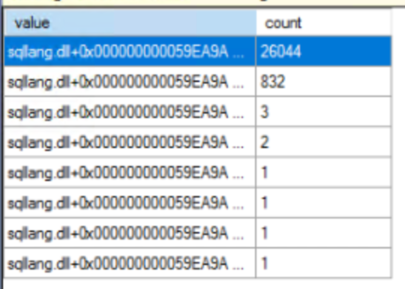
The results from the histogram target of your Extended Events session for spinlock backoffs provide some telling data. The screenshot shows a list of values, each representing a unique call stack in the SQL Server process, along with a count of how many times a backoff occurred for each call stack.
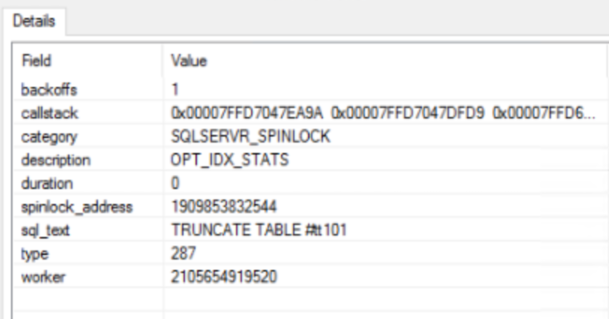
The histogram data collected from our Extended Events session has highlighted a notable frequency of spinlock backoffs associated with a specific call stack. To precisely identify the spinlock responsible for this contention, we can correlate the call stack with its corresponding spinlock name. In this case, by examining the collected event file — as opposed to the histogram — we have identified the contentious spinlock as ‘OPT_IDX_STATS’.
Decoding the Call Stack
The call stack obtained from the Extended Events session has been resolved with SQLCallstackResolver to reveal the sequence of operations within SQL Server leading up to the spinlock contention. The stack trace includes several functions, culminating in the CQSIndexStatsMgr::DropIndexStatsWithWildcards method.
Resolved Call Stack:
sqllang!XeSqlPkg::CollectSqlText<XE_ActionForwarder>
sqllang!XeSqlPkg::CollectSqlTextActionInvoke
sqldk!XeSosPkg::spinlock_backoff::Publish
sqldk!SpinlockBase::Sleep
sqldk!SpinlockBase::Backoff
sqllang!Spinlock<287,1,257>::SpinToAcquireWithExponentialBackoff
sqllang!CQSIndexStatsMgr::PqsisAdvanceInBucket
sqllang!CQSIndexStatsMgr::DropIndexStatsWithWildcards
sqllang!CQSIndexRecMgr::InvalidateMissingIndexes
sqllang!QPEvent::ModifyObject
sqllang!CStmtTruncateTable::XretExecute
sqllang!CMsqlExecContext::ExecuteStmts<1,0>
sqllang!CMsqlExecContext::FExecute
sqllang!CSQLSource::Execute
sqllang!process_request
sqllang!process_commands_internal
sqllang!process_messages
sqldk!SOS_Task::Param::Execute
sqldk!SOS_Scheduler::RunTask
sqldk!SOS_Scheduler::ProcessTasks
sqldk!SchedulerManager::WorkerEntryPoint
sqldk!SystemThreadDispatcher::ProcessWorker
sqldk!SchedulerManager::ThreadEntryPoint
KERNEL32+0x17974
From the call stack, it appears that after a TRUNCATE TABLE operation, SQL Server proceeds to invalidate cache entries for missing index suggestions. This process requires access to the OPT_IDX_STATS spinlock to safely update the cache. If multiple TRUNCATE TABLE statements are executed concurrently, or in quick succession, it can lead to contention for this spinlock as each transaction tries to update the same cache concurrently.
Resolution
The workaround for this issue is to enable the Trace Flag (TF) 2392 which will suppress the collection of missing indexes.
This trace flag was mentioned in KB4042232 – FIX: Access violation when you cancel a pending query if the missing indexes feature is enabled in SQL Server – Microsoft Support
After applying the trace flag, we resumed monitoring with the ‘truncate’ Extended Event session. Significantly, we observed no instances of TRUNCATE events exceeding 100ms in CPU time. Furthermore, as a beneficial side effect on the production system, we noted a decrease in CPU utilization during business hours, dropping from an average of ~40% to about 30%.
My Perspective
The behavior observed in SQL Server appears to be ‘by design.’ However, it’s perplexing why there’s a need to invoke ‘InvalidateMissingIndexes’ when truncating a temporary table. Considering potential solutions, the Microsoft product group might explore the following options:
- Re-evaluating Necessity: Determine the actual need for invalidating missing indexes during the truncation of temporary tables. If found unnecessary, this step could be bypassed to avoid the issue.
- Trace Flag 2392 Utilization: This flag currently suppresses the collection of missing indexes for the entire instance. A more targeted approach could be to enable its application on a specific database level. With many new features undergoing testing in Azure, this could be a feasible solution to explore.
- Spinlock Partitioning: If avoiding the call to ‘InvalidateMissingIndexes’ isn’t feasible and controlling it at the database level is not an option, another possibility could be to partition the OPT_IDX_STATS spinlock. This might alleviate contention and improve performance.
These suggestions aim to address the root of the problem while maintaining the integrity and functionality of SQL Server’s operations.