Today, I want to share an intriguing case that might change how you use extended event sessions. It involves a LOCK_HASH spinlock issue that caused significant performance problems on a busy SQL Server. This case will show you the hidden costs of collecting statement-level events.
Issue Overview
The issue arose on:
- Microsoft SQL Server 2022 (RTM-CU8) (KB5029666) – 16.0.4075.1 (X64)
- 2 sockets, 32 cores (VMware)
- 80 GB RAM
- Average transactions per second: 6500
- Average CPU utilization: 22%
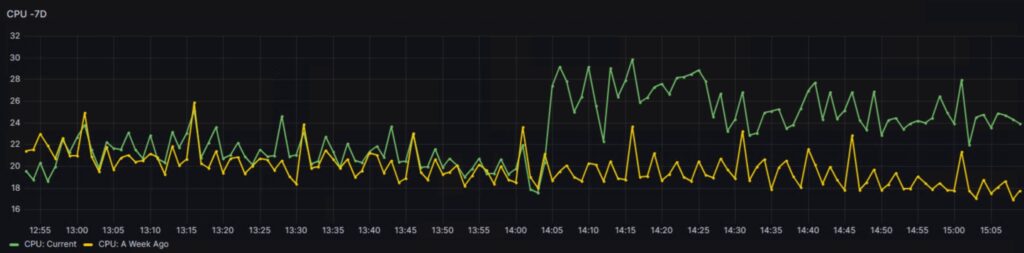
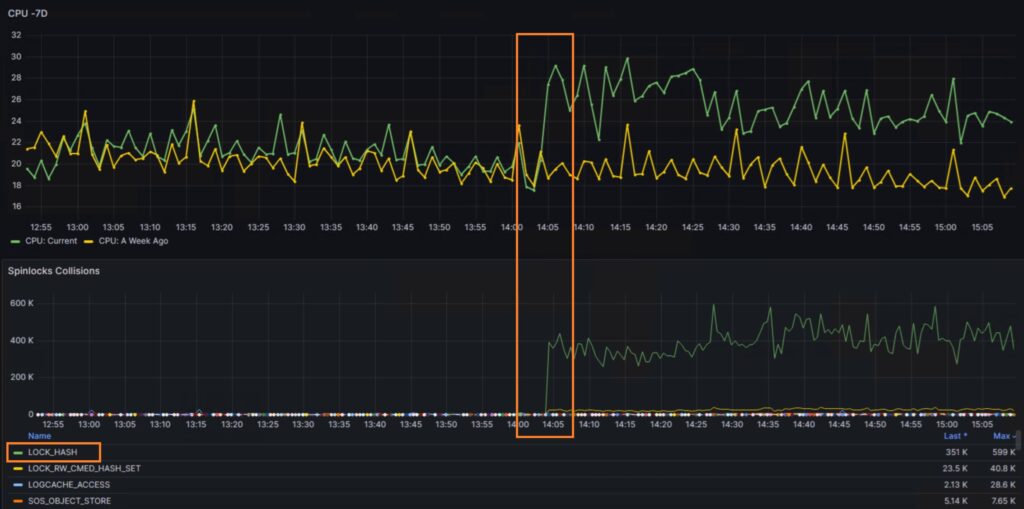
My attention was drawn to this problem when I noticed an immediate 5-8% increase in average CPU utilization, which caused a noticeable slowdown in performance. The graph below illustrates the impact on CPU usage as monitored in the existing setup:
Investigation Steps
To identify the root cause, we checked several potential factors:
- Code Release: Verified if any new code was released recently.
- CPU-Intensive Queries: Investigated if specific queries were consuming more CPU.
- Plan Changes: Checked for any plan changes in stored procedures.
- Data Changes: Looked for significant changes in data, such as bulk loads or mass updates.
- System Sessions: Analyzed utilization from system sessions, including ghost cleanup processes.
Despite these checks, the overall user workload continued to perform slower than expected.
Investigating Spinlock Contention
The next step was to check for spinlock contention, and we encountered a significant surprise:
Understanding LOCK_HASH Spinlock
According to the official documentation, LOCK_HASH: Protects access to the lock manager hash table, which stores information about the locks being held in a database. For more details, refer to KB2926217 and the Transaction Locking and Row Versioning Guide.
From SQL Server Spinlocks – sqlshack.com:
Spinlock contention, particularly related to the LOCK_HASH spinlock type, can cause performance issues. Large values of LOCK_HASH spinlocks, combined with high numbers of spins, collisions, and backoffs, suggest potential spinlock contention. The common causes and mitigation strategies include:
- Using the shortest possible transactions
- Ensuring the application does not use multiple sessions for updating the same data
- Turning off page-level locking
- Closely tracking lock escalation to reduce contention on the hash bucket
- Potentially using the NOLOCK hint in queries when multiple threads try to read the same data simultaneously
Case Analysis
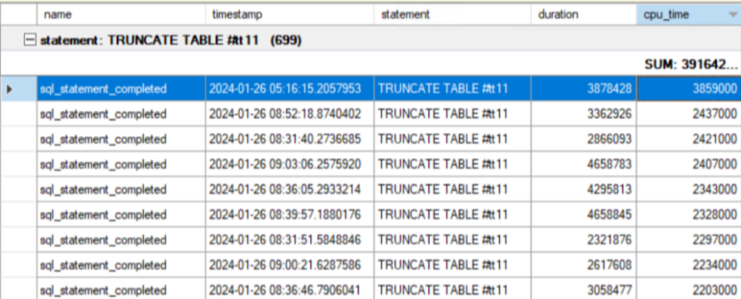
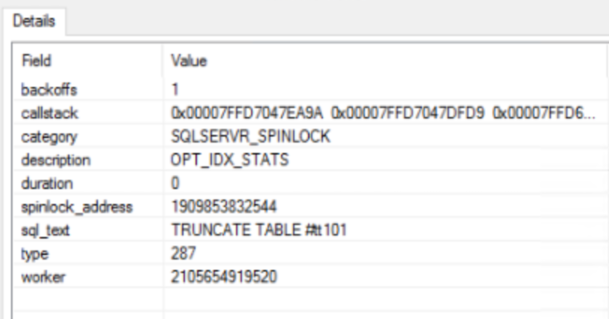
In my situation, none of the documented potential root causes were identified. The issue coincided with the start of an extended event session. By simplifying the session in a few steps, I isolated the field causing the spinlock. When the ‘sp_statement_completed’ field’s ‘statement’ was added, the issue could be reproduced consistently. Code example below:
CREATE EVENT SESSION [hash_spinlock_test] ON SERVER
ADD EVENT sqlserver.sp_statement_completed(SET collect_object_name=(1),collect_statement=(1)
    ACTION(sqlserver.client_hostname,sqlserver.database_id,sqlserver.session_id,sqlserver.username)
    WHERE ([duration]>=(100000)))
ADD TARGET package0.event_file(SET filename=N'hash_spinlock_test.xel',max_file_size=(100))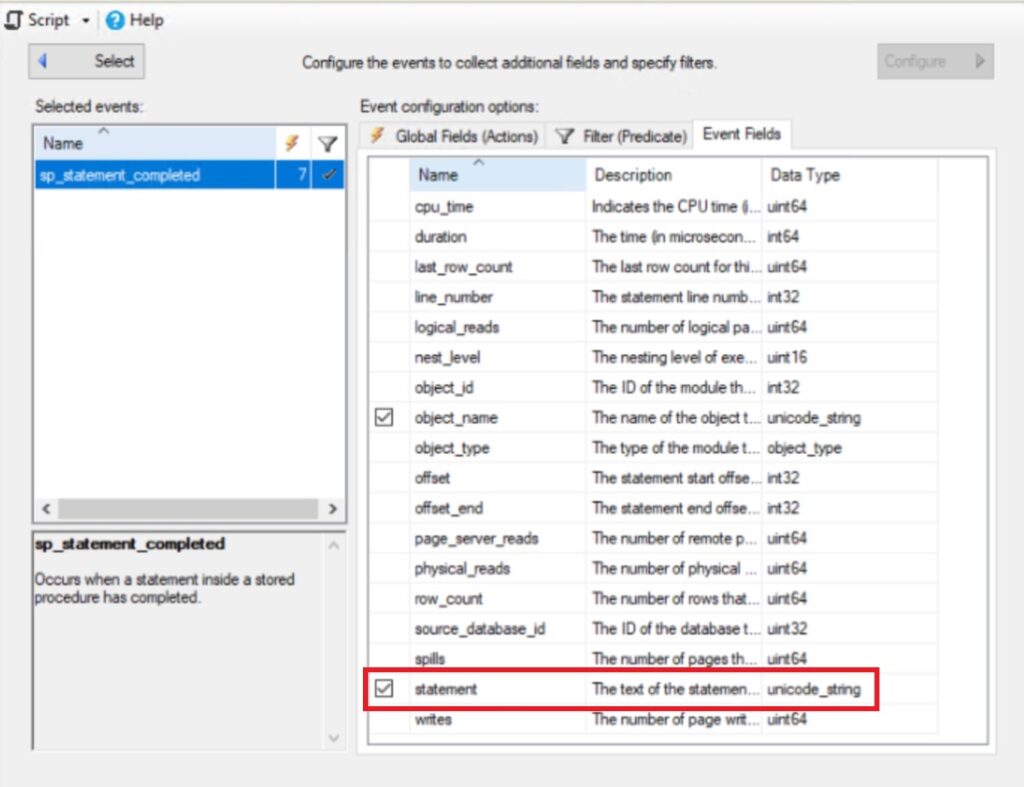
There is a filter configured for duration, so we will capture only events with a duration of 1 second or more, as there are no statements that execute this long on our system. However, right after the session starts, we see the LOCK_HASH spinlock usage skyrocket while recording zero events in the configured session. The worst part is that stopping the extended event session does not reduce the spinlock contention. In my case, the only solution was to restart the instance.
You might think I’m complaining about nothing and that this extra CPU utilization doesn’t impact workload. To illustrate the impact, here’s a comparison of average execution times for our top stored procedures:
| Stored Procedure | Avg Time (ms) Without LOCK_HASH Spinlock | Avg Time (ms) With LOCK_HASH Spinlock Issue | Difference (%) |
|---|---|---|---|
| SP one | 29 | 41 | 41% |
| SP two | 49 | 50 | 2% |
| SP three | 38 | 51 | 34% |
As shown, our top stored procedure became 41% slower.
Diagnosing the Issue
The easiest way to confirm if you have the same issue is to monitor the “Lock Requests/sec” performance counter. In my case, it increased from 170k to over 700k and didn’t normalize until a restart. This can be a quick diagnostic tool. If you notice similar symptoms, the spinlock monitoring techniques described in my previous post could help confirm the issue.
Conclusion
It’s advisable to avoid collecting the statement field in the sp_statement_completed event on a busy server, as it can lead to significant performance degradation. Even after stopping the extended event session, the issue with the LOCK_HASH spinlock persists. Currently, the only workaround I know is to restart the SQL Server instance.
Open Questions
- Bug or Design? Is this behavior a bug or by design? Collecting statement-level information is understandably performance-intensive, but it raises the question: why do we need to call all these functions to get the statement if, in the end, the extended event session records zero events? It seems logical that we should collect each statement if we are using it as a filter.
- Post-Session Issue Persistence: Why does the LOCK_HASH spinlock contention remain high and the server remain slow even after stopping the extended event session?
These questions highlight the need for further investigation to fully understand and mitigate the impact of collecting statement-level events on SQL Server performance.
Call Stack Examples
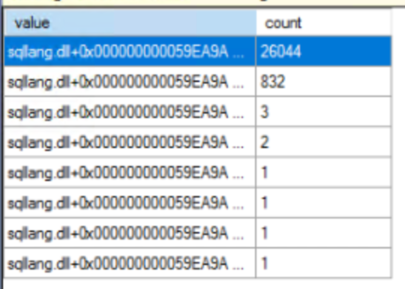
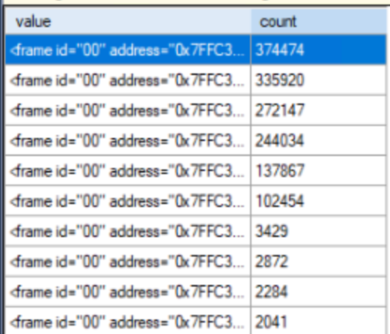
I have collected the call stack for a short period, and the top three entries are shown below:
top 1
00 SqlDK!GenericEvent::PublishAndCallAction
01 SqlDK!XeSosPkg::spinlock_backoff::Publish
02 SqlDK!SpinlockBase::Sleep
03 SqlDK!SpinlockBase::Backoff
04 sqlmin!Spinlock<187,7,257>::SpinToAcquireWithExponentialBackoff
05 sqlmin!lck_unlockInternal
06 sqlmin!BlobManager::UnLockRoot
07 sqlmin!BlobManager::Cleanup
08 sqlmin!LockBytesSS::GoDormant
09 sqlmin!LockBytesSS::Release
0a sqlmin!CMEDScanLob::`vector deleting destructor'
0b sqlmin!CMEDAccess::~CMEDAccess
0c sqlmin!CMEDAccess::`vector deleting destructor'
0d sqllang!CSQLObject::GetCharsFromModule
0e sqllang!CSQLObject::CbGetChars
0f sqllang!TraceUtil::GetStatementInfoBase<1>
10 sqllang!TraceUtil::GetStatementInfo
11 sqllang!CMsqlExecContext::ExecuteStmts<1,0>
12 sqllang!CMsqlExecContext::FExecute
13 sqllang!CSQLSource::Execute
14 sqllang!CStmtExecProc::XretLocalExec
15 sqllang!CStmtExecProc::XretExecExecute
16 sqllang!CXStmtExecProc::XretExecute
17 sqllang!CExecStmtLoopVars::ExecuteXStmtAndSetXretReturn
18 sqllang!CMsqlExecContext::ExecuteStmts<1,0>
19 sqllang!CMsqlExecContext::FExecute
1a sqllang!CSQLSource::Execute
1b sqllang!CStmtExecProc::XretLocalExec
1c sqllang!CStmtExecProc::XretExecExecute
1d sqllang!CXStmtExecProc::XretExecute
1e sqllang!CExecStmtLoopVars::ExecuteXStmtAndSetXretReturn
1f sqllang!CMsqlExecContext::ExecuteStmts<1,0>
20 sqllang!CMsqlExecContext::FExecute
21 sqllang!CSQLSource::Execute
top 2
00 SqlDK!GenericEvent::PublishAndCallAction
01 SqlDK!XeSosPkg::spinlock_backoff::Publish
02 SqlDK!SpinlockBase::Sleep
03 SqlDK!SpinlockBase::Backoff
04 sqlmin!Spinlock<187,7,257>::SpinToAcquireWithExponentialBackoff
05 sqlmin!lck_lockInternal
06 sqlmin!BlobBase::GetLock
07 sqlmin!BlobBase::LockRID
08 sqlmin!BlobManager::SetupInRowBlobRoot
09 sqlmin!BlobManager::OpenInternal
0a sqlmin!BlobManager::Open
0b sqlmin!LockBytesSS::Open
0c sqlmin!OpenLockBytesNew
0d sqlmin!GetDataAsILockBytes<0>
0e sqlmin!IndexDataSetSession::GetDataLong<0>
0f sqlmin!IndexDataSetSession::GetDataInternal
10 sqlmin!RowsetNewSS::GetData
11 sqlmin!CMEDScan::GetLOB
12 sqlmin!CMEDCatYukonObject::GetSQLExprLob
13 sqlmin!CMEDProxySQLExpression::GetSQLExprLobSrc
14 sqllang!CSQLObject::GetCharsFromModule
15 sqllang!CSQLObject::CbGetChars
16 sqllang!TraceUtil::GetStatementInfoBase<1>
17 sqllang!TraceUtil::GetStatementInfo
18 sqllang!CMsqlExecContext::ExecuteStmts<1,0>
19 sqllang!CMsqlExecContext::FExecute
1a sqllang!CSQLSource::Execute
1b sqllang!CStmtExecProc::XretLocalExec
1c sqllang!CStmtExecProc::XretExecExecute
1d sqllang!CXStmtExecProc::XretExecute
1e sqllang!CExecStmtLoopVars::ExecuteXStmtAndSetXretReturn
1f sqllang!CMsqlExecContext::ExecuteStmts<1,0>
20 sqllang!CMsqlExecContext::FExecute
21 sqllang!CSQLSource::Execute
top 3
00 SqlDK!GenericEvent::PublishAndCallAction
01 SqlDK!XeSosPkg::spinlock_backoff::Publish
02 SqlDK!SpinlockBase::Sleep
03 SqlDK!SpinlockBase::Backoff
04 sqlmin!Spinlock<187,7,257>::SpinToAcquireWithExponentialBackoff
05 sqlmin!lck_lockInternal
06 sqlmin!GetDataLock
07 sqlmin!BTreeRow::AcquireLock
08 sqlmin!IndexDataSetSession::GetRowByKeyValue
09 sqlmin!IndexDataSetSession::FetchRowByKeyValueInternal
0a sqlmin!RowsetNewSS::FetchRowByKeyValueInternal
0b sqlmin!RowsetNewSS::FetchRowByKeyValue
0c sqlmin!CMEDScan::StartSearch
0d sqlmin!CMEDCatYukonObject::GetSQLExprLob
0e sqlmin!CMEDProxySQLExpression::GetSQLExprLobSrc
0f sqllang!CSQLObject::GetCharsFromModule
10 sqllang!CSQLObject::CbGetChars
11 sqllang!TraceUtil::GetStatementInfoBase<1>
12 sqllang!TraceUtil::GetStatementInfo
13 sqllang!CMsqlExecContext::ExecuteStmts<1,0>
14 sqllang!CMsqlExecContext::FExecute
15 sqllang!CSQLSource::Execute
16 sqllang!CStmtExecProc::XretLocalExec
17 sqllang!CStmtExecProc::XretExecExecute
18 sqllang!CXStmtExecProc::XretExecute
19 sqllang!CExecStmtLoopVars::ExecuteXStmtAndSetXretReturn
1a sqllang!CMsqlExecContext::ExecuteStmts<1,0>
1b sqllang!CMsqlExecContext::FExecute
1c sqllang!CSQLSource::Execute
1d sqllang!CStmtExecProc::XretLocalExec
1e sqllang!CStmtExecProc::XretExecExecute
1f sqllang!CXStmtExecProc::XretExecute
20 sqllang!CExecStmtLoopVars::ExecuteXStmtAndSetXretReturn
21 sqllang!CMsqlExecContext::ExecuteStmts<1,0>